
Here is how you can read and display an electron density map. These are important to look at if you are to be critical of a particular PDB structure.
1a Load PDB

1b Download the corresponding CCP4 file from PDB.

2a Create a Vision Network.
 (middle button, boxes & lines, not the sunglasses button)
2b Load the Vis and Vol Libraries from Libraries--> Load Libraries....

2c Drag the following 'nodes' on to the blank 'canvas':
- 'Read Any Map' (Load CCP4 here) -from Vol Library (grey)
- 'Sample' (use a level 3 or two) - from Vol Library
- 'UT iso-contour' From Vol Library
- 'Ind Polygons' -from Vis Library (yellow)
- 'PMV Viewer' - from PMV Library (purple-ish/blue?... hmm. Periwinkle!)
(it helps to use the search box  to find these nodes)

Connect these nodes by dragging lines from the output ports (bottom square things) to the input ports(top square things) (colors should correspond [mostly]):
3 Double-click the UT iso-contour 'node' to see the isocontour graphs. Looks like this:

4 Drag the black vertical line to Pick an iso-value that suits your purposes. It will be hairy, so you may want to...

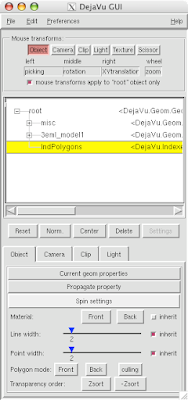
5 Open DejaVu (it's the left-erly button with a cube, sphere and pyramid) to adjust opacity and or clipping of the IndPolygons geometry you just created!
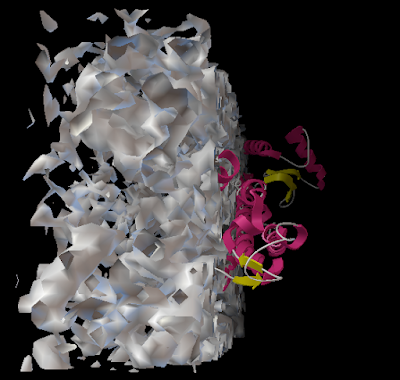

And you can end up with something like this or (probably) better. Explore around. Have fun. Get good.

--
Jon Huntoon


1 comments:
Excellent tutorial. Thanks!
I haven't heard of eds.bmc.uu.se server before.
Post a Comment