
-how to calculate the SAS and SES area
-how to colorize SAS or SES residues
-how to list the residues of SAS or SES
1. To calculate the SAS and SES area, simply goto Compute-->Molecular Surface-->'Solvent Excluded and Accessible Areas'.
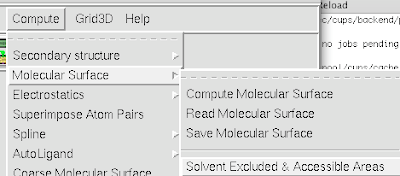
The area listed is in square Angstroms.
2. To colorize the residues involved in a SAS or SES, goto Color-->by Property-->
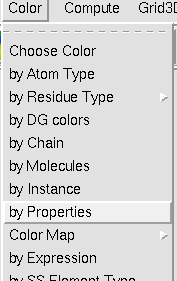
Choose the Residue property level. Select SAS or SES area. Be sure to also click the '>>' box to ensure the color is placed along the full spectrum of residues.
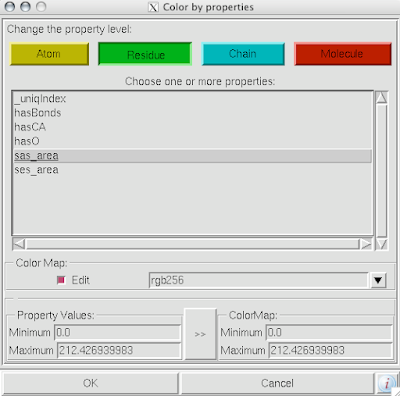
If you click 'edit', you can edit the color spectrum along the residues indicated by the y-axis.
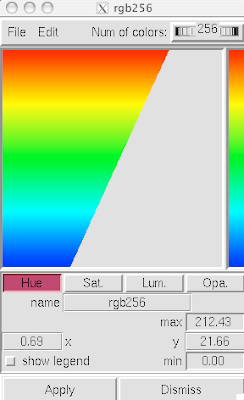
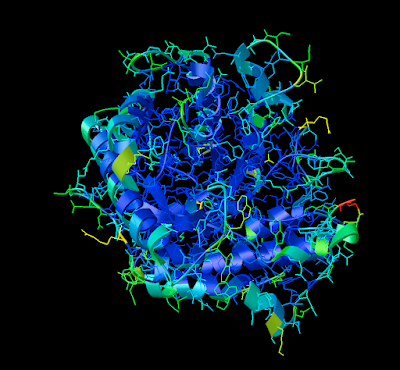

3. To get a relevant list of the outward bound residues of the SAS or SES, that is, the residues colored green or yellow or red in the above figures, you must open the python shell.
Type: "mol=self.Mols[0]", enter.
Type: "list=[]", enter.
Type: "for res in mol.chains[0].residues:)", enter.
It should be tabbed over.
Type: "if res.sas_area > 70.0 : list.append( res.full_name())" , enter.
By the way, 70 is an arbitrary number that indicates a depth of surface penetration.
You should get plenty of blue ink. If you get red ink, you probably have a typo.
Click on the image to zoom in:


0 comments:
Post a Comment