
What is the difference between the Solvent Accessible Surface and the Solvent Excluded Surface (SES)? And how can I visualize the Solvent Accessible Surface?
The difference is that in a SAS, the surface is drawn from the center point of the probe radius, while in a SES, the surface is drawn from the touching point of the probe radius.
The SES is your typical molecular surface as seen in PMV's MSMS or PyMol (again MSMS), Chimera, Jmol and others. It is also known as a Connely surface. Luckily for us, PMV utilizes Michel Sanner's Molecular Surface (MSMS) algorithm which is generally considered to be the fastest SES calculator.
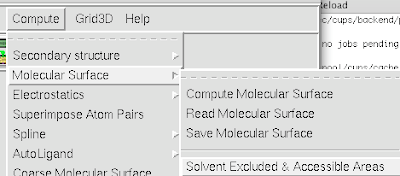
1. To create an SES, simply goto Compute-->Molecular Surface-->'Compute Molecular Surface'. Use the defaults or change them to suit your need, and click 'okay'.

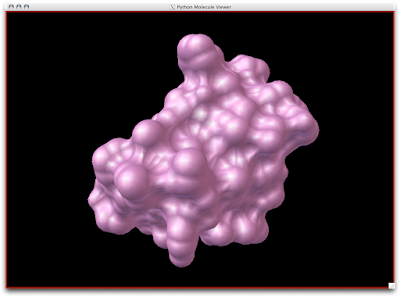 Easy-peasy, lemon-squeazy. Now, to understand that the SES is a tighter surface than the SAS, we can look at the CPK Sphere representation with the SES (pink, semi-transparent) draped upon the atoms:
 Notice how the probe radius really wedges up and along the surface atoms for a snug surface:
 Now, the Solvent Accessible Surface (SAS) is created in a different manner.
 1. Open Vision, Load MolKit library, and drag down the MSMS macro. Connect your molecule and the PMV viewer.
 2. Double click the MSMS macro to open it.
3. Right-click to delete the Green and Blue lines connecting the 'MSMS triang.' node to the 'indexed polygons' node.


5. Double click the 'MSMS' node inside the 'MSMS macro' node and adjust the density to at least 6.0.


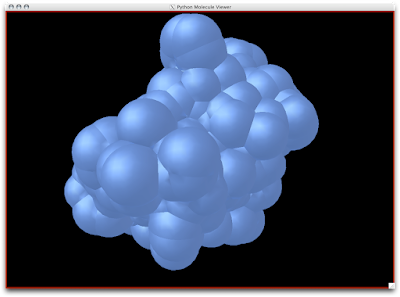
Here is SAS (slightly-transparent blue), SES/MSMS(slightly-transparent pink), and CPK Spheres (colored by atom) all super-imposed:

SAS colored by David Goodsell coloring:
 Bonus:
1. To calculate the SAS and SES area, simply goto Compute-->Molecular Surface-->'Solvent Excluded and Accessible Areas'.
The area listed is in square Angstroms.


4 comments:
Thanks Jon for the very helpful and well written tutorial. Keep it up!
I cannot see what says number 4
I don't know why #4 isn't showing. I'll try to fix it but it the mean time, here is the text:
"Drag down two 'ArrayFunc2' nodes and one 'dial' node from the green 'Standard' menu. Connect them as shown below and set the dial to 1.5:"
How do you avoid overlapping of the connection lines
Post a Comment