Pages

Apr 27, 2010

Making David Goodsell like illustrations.


David Goodsell as you may know, is an exceptional artist and brilliant communicator. His watercolors have been published in magazines, journals, and books (The Machinery of LifeBionanotechnology: Lessons from Nature) and hung up in galleries and exhibits around the world. He writes a monthly column for the Protein Data Bank (PDB) called 'Molecule of the Month'

Lucky us, PMV has an auto 'David Goodsell' feature. 


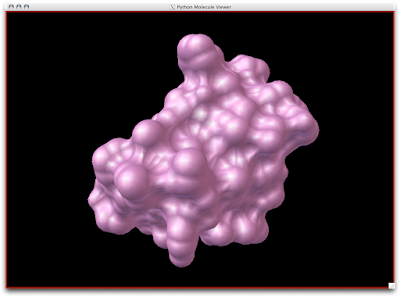
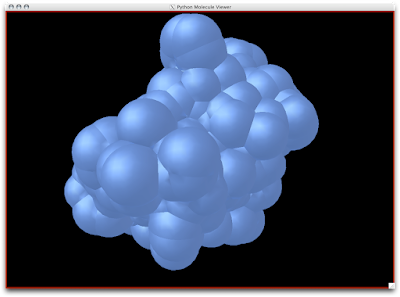
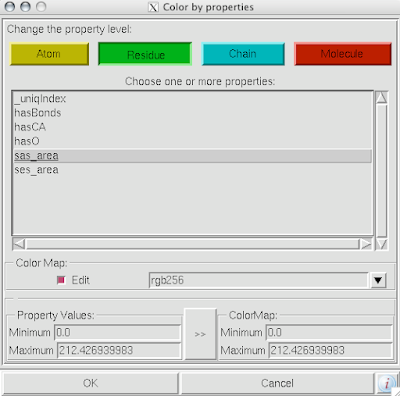
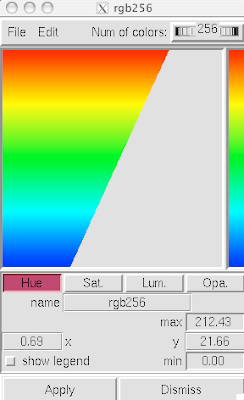
1. Firstly, there is the "DG Colors" under the color menu. This coloring is similar to atomic but the intensity of the red and blue on oxygens and nitrogen respectively corresponds to the charge of the residue upon which the atom resides. For example, a highly negatively charge oxygens on glutamate will be deep red, where as the less negatively charged oxygens on threonine will be pink. Conversely, the strongly positive charged nitrogen upon the lysine will be dark blue while the less positive nitrogens on histidine are sky blue.  A clever coloring scheme that incorporate charge and atom property is one way in which the David Goodsell style conveys so much information without becoming too busy. 


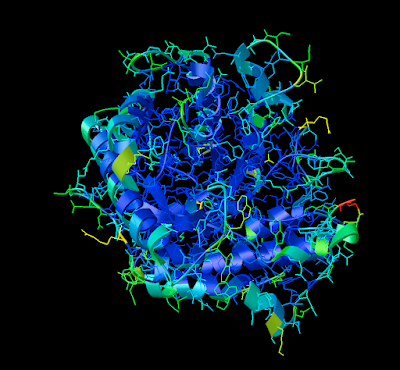
2. Now that your models are colored according the custom DG scheme, it is time to emulate the subtle beauty of his water colors. Turn on the 'cartoon mode'.
adjust if you wish:


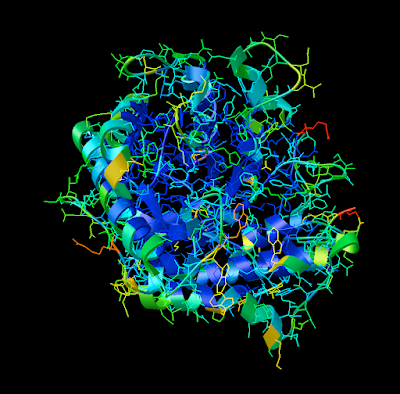
3. Now you are officially David Goodsell-esque. The last recommendation I have is to increase the anti-aliasing to at least 4. Beyond 8, the anti-aliasing tends to suck too much CPU power. 


ENJOY!

Apr 14, 2010

Visualizing the Solvent Accessible Surface (SAS) and Solvent Excluded Surface


What is the difference between the Solvent Accessible Surface and the Solvent Excluded Surface (SES)? And how can I visualize the Solvent Accessible Surface?

The difference is that in a SAS, the surface is drawn from the center point of the probe radius, while in a SES, the surface is drawn from the touching point of the probe radius.

The SES is your typical molecular surface as seen in PMV's MSMS or PyMol (again MSMS), Chimera, Jmol and others. It is also known as a Connely surface. Luckily for us, PMV utilizes Michel Sanner's Molecular Surface (MSMS) algorithm which is generally considered to be the fastest SES calculator.


1. To create an SES, simply goto Compute-->Molecular Surface-->'Compute Molecular Surface'. Use the defaults or change them to suit your need, and click 'okay'.


Easy-peasy, lemon-squeazy. Now, to understand that the SES is a tighter surface than the SAS, we can look at the CPK Sphere representation with the SES (pink, semi-transparent) draped upon the atoms:

Notice how the probe radius really wedges up and along the surface atoms for a snug surface:
Now, the Solvent Accessible Surface (SAS) is created in a different manner.

1. Open Vision, Load MolKit library, and drag down the MSMS macro. Connect your molecule and the PMV viewer.

2. Double click the MSMS macro to open it.


3. Right-click to delete the Green and Blue lines connecting the 'MSMS triang.' node to the 'indexed polygons' node.


4. Drag down two 'ArrayFunc2' nodes and one 'dial' node from the green 'Standard' menu. Connect them as shown below and set the dial to 1.5:

5. Double click the 'MSMS' node inside the 'MSMS macro' node and adjust the density to at least 6.0.


6. Finally, click the lightning bolt a time or two and you should now have the solvent accessible surface, visualized. See how much fatter it is than the SES? Look below:


Here is SAS (slightly-transparent blue), SES/MSMS(slightly-transparent pink), and CPK Spheres (colored by atom) all super-imposed:

SAS colored by David Goodsell coloring:


Bonus:


1. To calculate the SAS and SES area, simply goto Compute-->Molecular Surface-->'Solvent Excluded and Accessible Areas'.


The area listed is in square Angstroms.


**The SAS are correlates to the de-solvation energy.

Solvent Excluded Surface and Solvent Accessible Surface


Solvent Excluded Surface (SES) and Solvent Accessible Surface (SAS)

-how to calculate the SAS and SES area
-how to colorize SAS or SES residues
-how to list the residues of SAS or SES


1. To calculate the SAS and SES area, simply goto Compute-->Molecular Surface-->'Solvent Excluded and Accessible Areas'.


The area listed is in square Angstroms.
2. To colorize the residues involved in a SAS or SES, goto Color-->by Property-->


Choose the Residue property level. Select SAS or SES area. Be sure to also click the '>>' box to ensure the color is placed along the full spectrum of residues.


If you click 'edit', you can edit the color spectrum along the residues indicated by the y-axis.

3. To get a relevant list of the outward bound residues of the SAS or SES, that is, the residues colored green or yellow or red in the above figures, you must open the python shell.


Type: "mol=self.Mols[0]", enter.
Type: "list=[]", enter.
Type: "for res in mol.chains[0].residues:)", enter.
It should be tabbed over.
Type: "if res.sas_area > 70.0 : list.append( res.full_name())" , enter.
By the way, 70 is an arbitrary number that indicates a depth of surface penetration.
You should get plenty of blue ink. If you get red ink, you probably have a typo.

Click on the image to zoom in:

Apr 7, 2010

Load Multiple Molecules Simultaneously


This is one method. There are many. Specifically, this is useful for opening multiple pdb or pdbqt files at the same time. People who are docking or doing molecular dynamics (MD) use scripts like this all the time. This is just one....

1. In PMV, open the Python Shell.


2. Type "import glob", hit enter.
3. Type "fl = glob.glob("/Users/yourUserNamer/MoleculeFolder/*.pdb")", hit enter. The asterisk tells PMV to find and use anything ending in ".pdb"

4. Type "len(fl)", hit enter. This is a check that your script is working. What appears afterword should be a number- specifically the number of PDBs you
wish to import. In this example, I am loading 15 molecules.


5. Type "for x in fl: self.readMolecule(x)", hit enter. A string of blue should show up indicating each loaded PDB file.


Then choose you representation and enjoy!


Powered by Blogger